
Notice
Recent Posts
Recent Comments
Link
| 일 | 월 | 화 | 수 | 목 | 금 | 토 |
|---|---|---|---|---|---|---|
| 1 | 2 | 3 | 4 | 5 | 6 | 7 |
| 8 | 9 | 10 | 11 | 12 | 13 | 14 |
| 15 | 16 | 17 | 18 | 19 | 20 | 21 |
| 22 | 23 | 24 | 25 | 26 | 27 | 28 |
Tags
- Deep Learning
- Pre-processing
- 백준
- OOP
- 문자열
- 포인터
- 함수
- const
- C++
- raw data
- 알고리즘
- pass by reference
- Object Oriented Programming
- Class
- Data Science
- string
- pointer
- vscode
- assignment operator
- predictive analysis
- Python
- baekjoon
- 반복문
- 배열
- function
- array
- 티스토리챌린지
- 파이썬
- 오블완
- programming
Archives
- Today
- Total
Channi Studies
Trend, Pattern, and The Correlation Coefficient (r) 본문
Data Science/개념과 용어
Trend, Pattern, and The Correlation Coefficient (r)
Chan Lee 2024. 11. 15. 07:34When there are two numerical variables, there are
Trend
- Positive association
- Negative association
Pattern
- Any discernible "shape" in the scatter
- Linear
- Non-linear
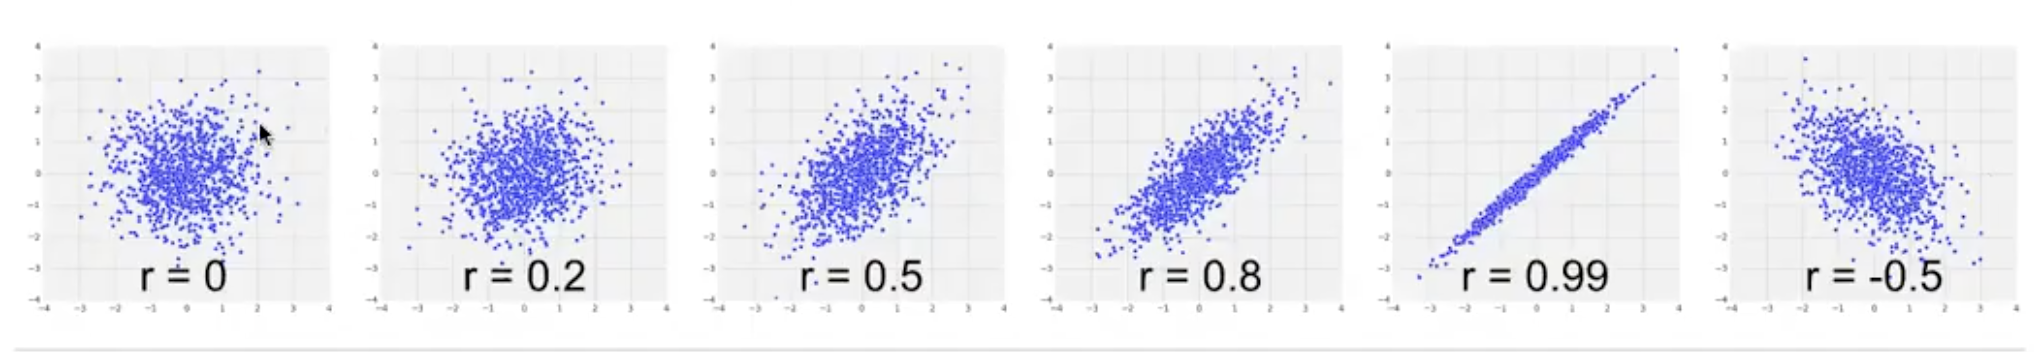
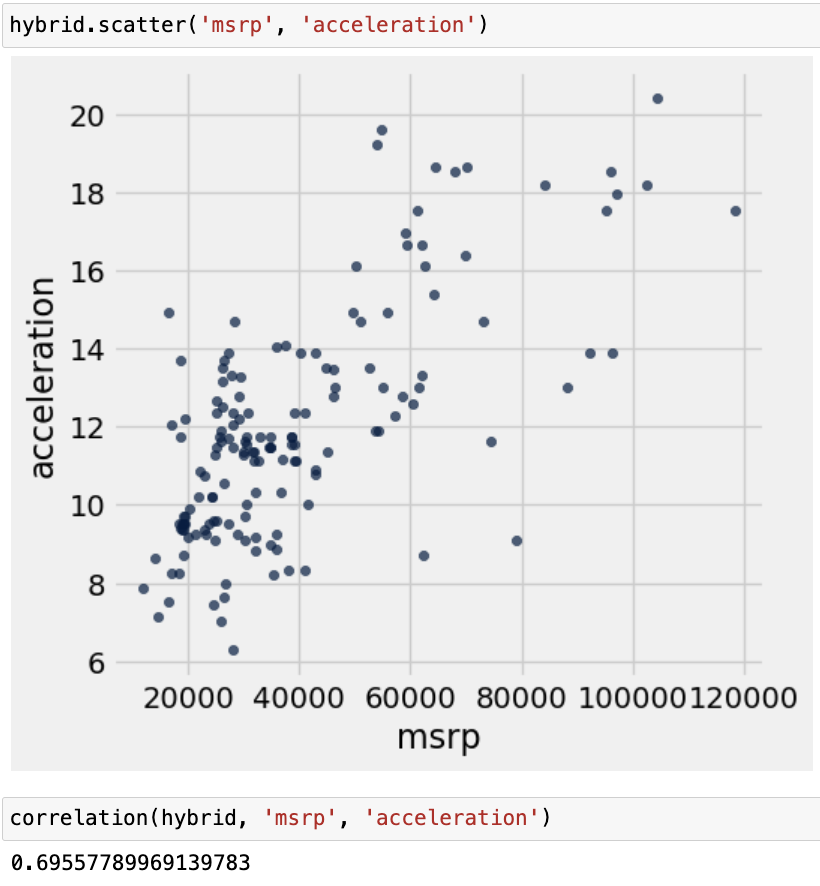
Visualize, then quantify
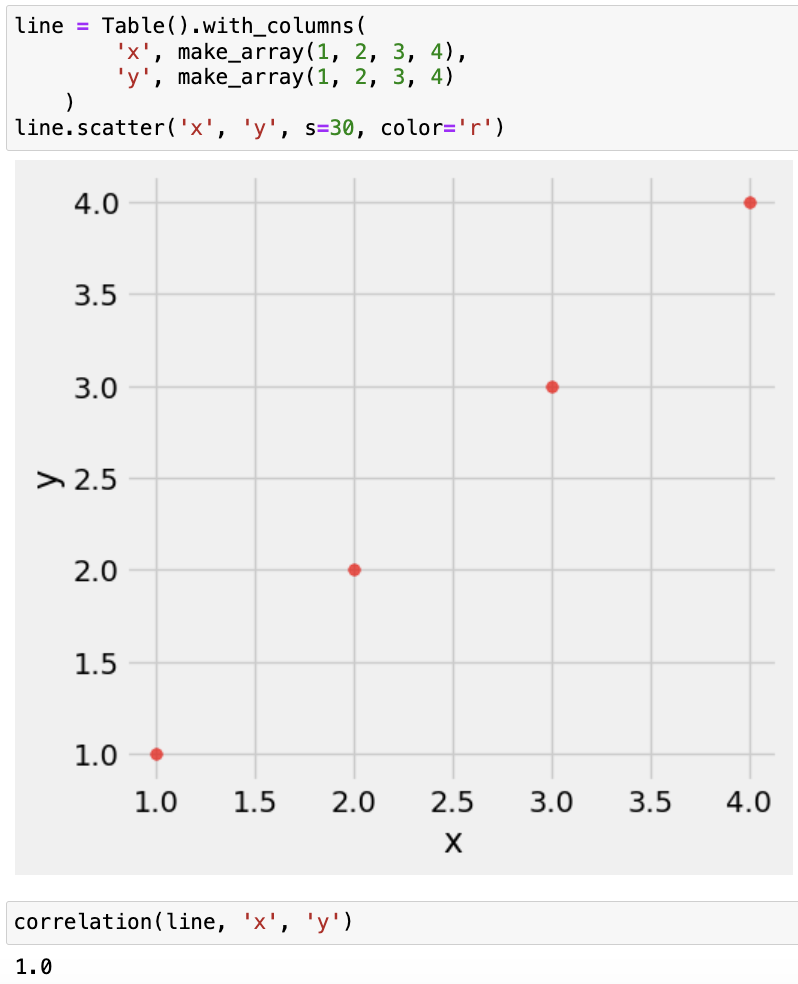
The Correlation Coefficient r
Measures linear association.
It is based on the standard units.
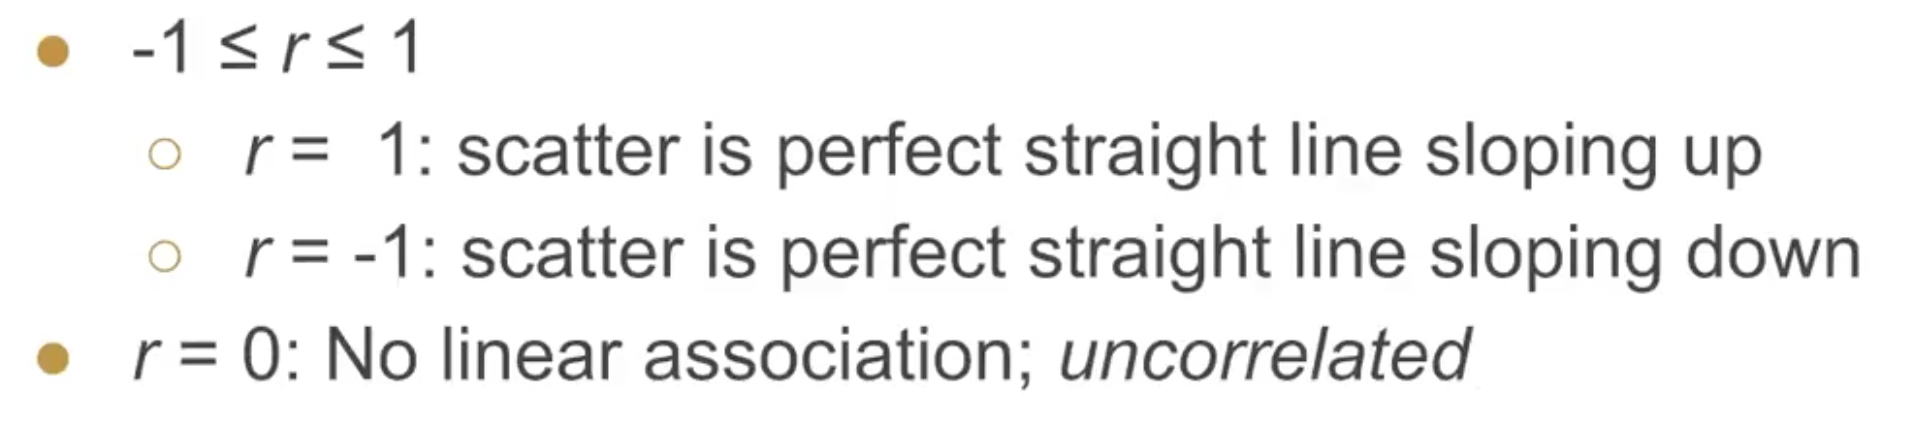
r is defined as:
The average of product of (x in standard units) and (y in standard units)
표준 단위 x와 표준 단위 y의 곱의 평균
In Python, we can write as:

정확하게 y = x^2 그래프의 값을 가지는 x와 y의 상관계수는 몇일까요?
x의 값을 알면 y는 정확하게 x^2이기 때문에 완벽하게 y값을 예측할 수 있습니다.
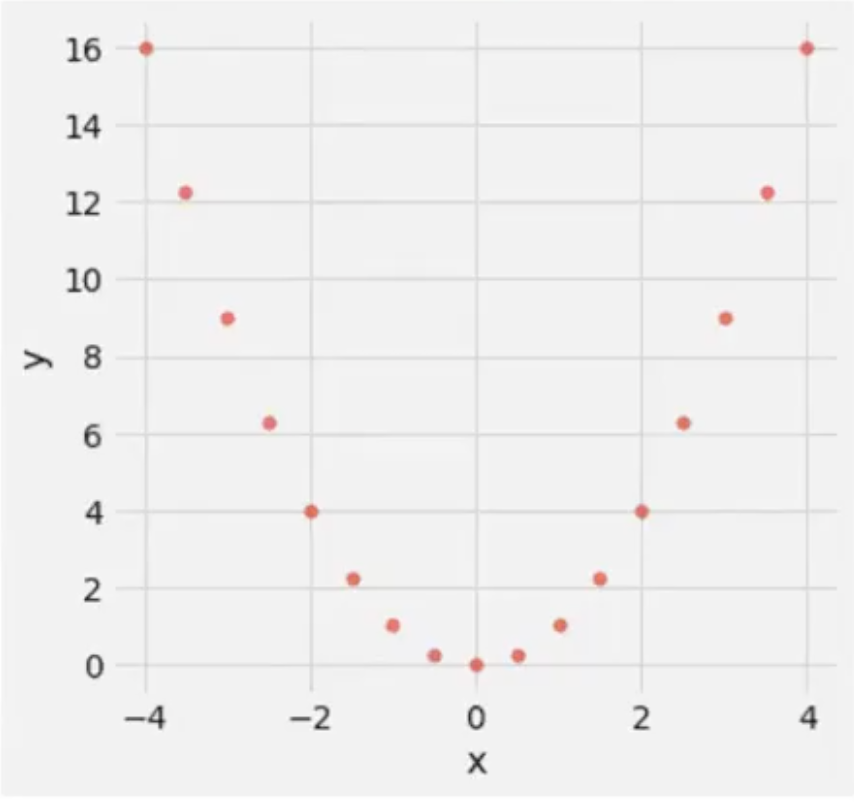
이런 경우에 Correlation Coefficient = 0 입니다.
왜냐하면 상기 서술하였듯 r value는 linear correlation을 설명하는 값이기 때문입니다.
이 값들을 하나의 직선으로 설명할 수 없다는 점을 이해하면 이러한 차이점을 이해할 수 있습니다.
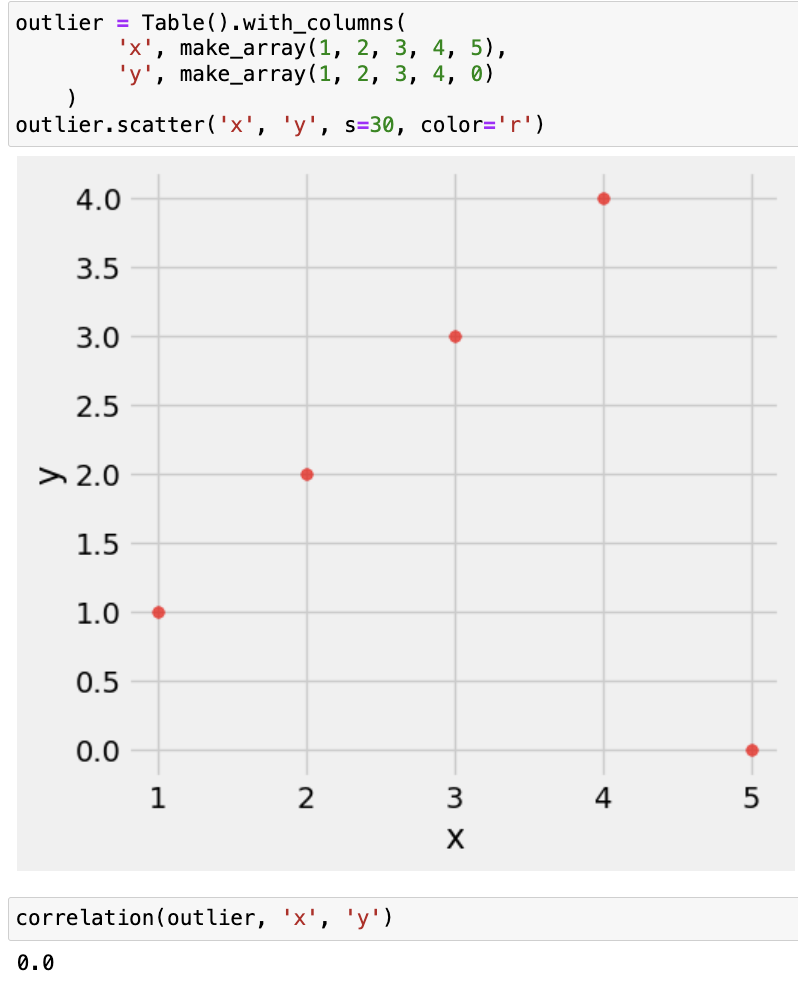
몇가지 추가 값 예시들을 보여드리고 마무리하겠습니다.
'Data Science > 개념과 용어' 카테고리의 다른 글
| Classification (Data Science), k-Nearest Neighbor Classifier (KNN) | 분류 (1) | 2024.11.29 |
|---|---|
| Slope and Y-intercept of The Regression Line | 회귀선의 기울기와 y절편 (0) | 2024.11.25 |
| How to Interpret Confidence Interval | 신뢰 구간의 해석 (2) | 2024.11.01 |
| A/B Testing (0) | 2024.10.29 |
| The Bootstrap Technique | 부트스트랩 (2) | 2024.10.23 |
'Data Science/개념과 용어' Related Articles
more

