

| 일 | 월 | 화 | 수 | 목 | 금 | 토 |
|---|---|---|---|---|---|---|
| 1 | 2 | 3 | 4 | 5 | ||
| 6 | 7 | 8 | 9 | 10 | 11 | 12 |
| 13 | 14 | 15 | 16 | 17 | 18 | 19 |
| 20 | 21 | 22 | 23 | 24 | 25 | 26 |
| 27 | 28 | 29 | 30 |
- array
- Class
- assignment operator
- 오블완
- 배열
- function
- Python
- raw data
- 문자열
- programming
- predictive analysis
- Deep Learning
- vscode
- OOP
- 반복문
- Pre-processing
- pointer
- C++
- 티스토리챌린지
- 함수
- 파이썬
- Data Science
- 알고리즘
- pass by reference
- 포인터
- baekjoon
- 백준
- const
- Object Oriented Programming
- string
- Today
- Total
목록티스토리챌린지 (2)
Channi Studies
 Slope and Y-intercept of The Regression Line | 회귀선의 기울기와 y절편
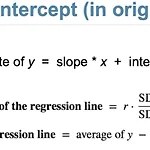
In a simple linear regression line (LMS), the regression line can be expressed as following equation:y = ax + bwherey = The variable that you want to predict (예측하고 싶은 값) | Dependent variable (종속 변수)x = The variable that you are using to predict (예측에 사용하는 값) | Independent variable (독립 변수)a = Slope (기울기)b = y-intercept (y 절편) 그렇다면, y = ax+b 에서 slope(a)와 y-intercept(b)는 어떻게 구하는지 알아보겠습니다. Recall, r ..
 Trend, Pattern, and The Correlation Coefficient (r)
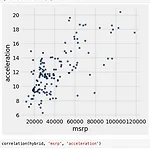
When there are two numerical variables, there are TrendPositive associationNegative association PatternAny discernible "shape" in the scatterLinear Non-linear Visualize, then quantify The Correlation Coefficient rMeasures linear association. It is based on the standard units. r is defined as:The average of product of (x in standard units) and (y in standard units) 표준 단위 x와 표준 단위 y의 곱의 평균 In P..